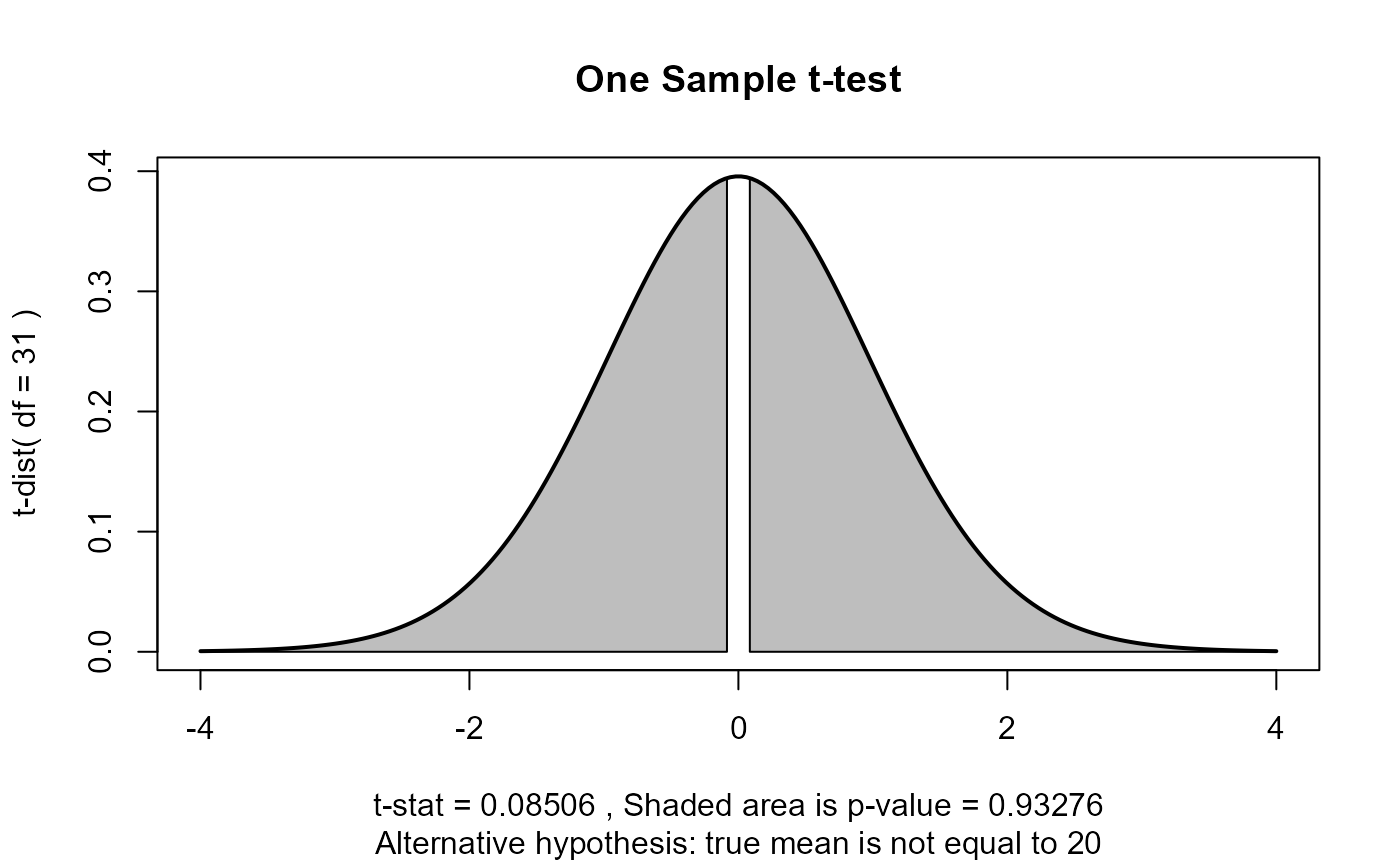
Plot the result of a t-test by shading the p-value area under the t-distribution
Source:R/e_plot_ttest_pval.R
e_plot_ttest_pval.RdPlot the result of a t-test by shading the p-value area under the t-distribution
e_plot_ttest_pval(t_summary, sw_graphics = c("ggplot", "base")[2])Arguments
- t_summary
the returned object from stats::t.test()
- sw_graphics
choice of ggplot or base graphics
Value
if base graphics, NULL invisibly; if ggplot, the plot grob