Calculate proportions and plot factor variable by up to two other factor variables
Source:R/e_plot_table_prop.R
e_plot_table_prop.RdCalculate proportions and plot factor variable by up to two other factor variables
e_plot_table_prop(dat_plot = NULL, var_names = NULL, sw_print = FALSE)Arguments
- dat_plot
data to plot
- var_names
proportions are calculated for first variable, by up to two other variables (row facets, then column facets),
c("y", "a", "b")- sw_print
T/F whether to print table and display plot
Value
a list including a table and ggplot objectExamples
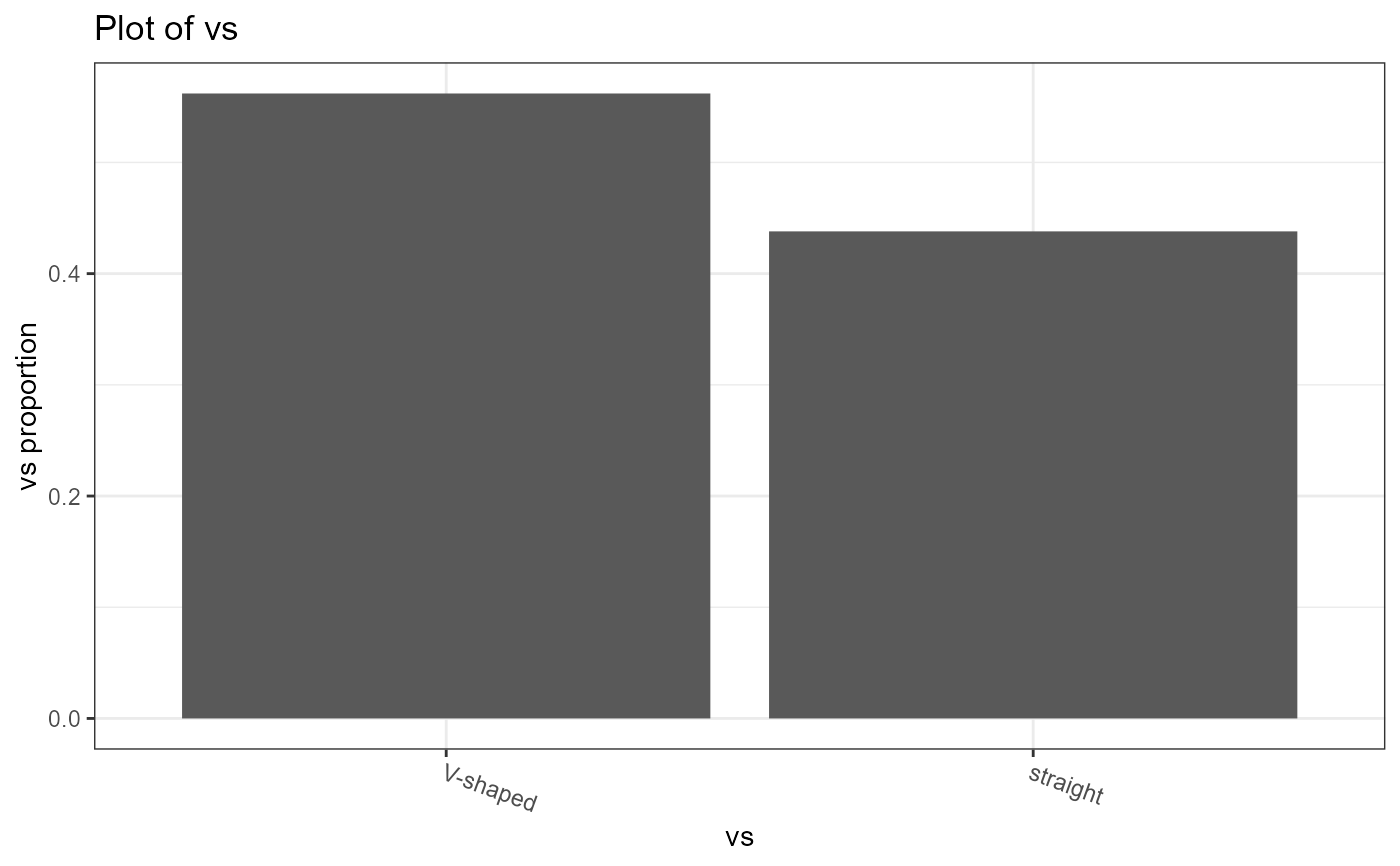
e_plot_table_prop(
dat_plot = dat_mtcars_e
, var_names = c("vs")
)
#> $table
#> # A tibble: 2 × 3
#> vs n prop
#> <fct> <int> <dbl>
#> 1 V-shaped 18 0.562
#> 2 straight 14 0.438
#>
#> $plot
 #>
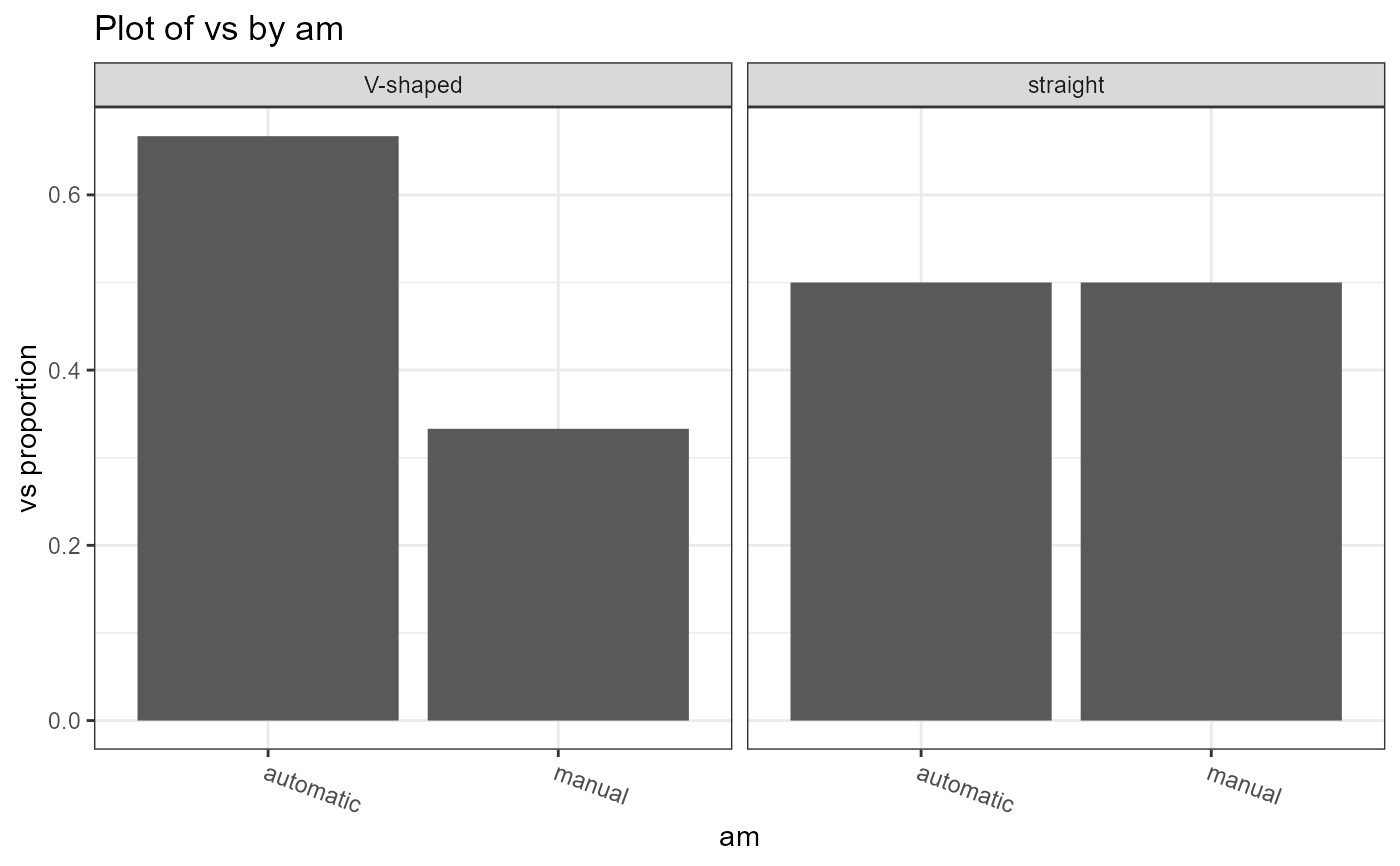
e_plot_table_prop(
dat_plot = dat_mtcars_e
, var_names = c("vs", "am")
)
#> $table
#> # A tibble: 4 × 4
#> vs am n prop
#> <fct> <fct> <int> <dbl>
#> 1 V-shaped automatic 12 0.667
#> 2 V-shaped manual 6 0.333
#> 3 straight automatic 7 0.5
#> 4 straight manual 7 0.5
#>
#> $plot
#>
e_plot_table_prop(
dat_plot = dat_mtcars_e
, var_names = c("vs", "am")
)
#> $table
#> # A tibble: 4 × 4
#> vs am n prop
#> <fct> <fct> <int> <dbl>
#> 1 V-shaped automatic 12 0.667
#> 2 V-shaped manual 6 0.333
#> 3 straight automatic 7 0.5
#> 4 straight manual 7 0.5
#>
#> $plot
 #>
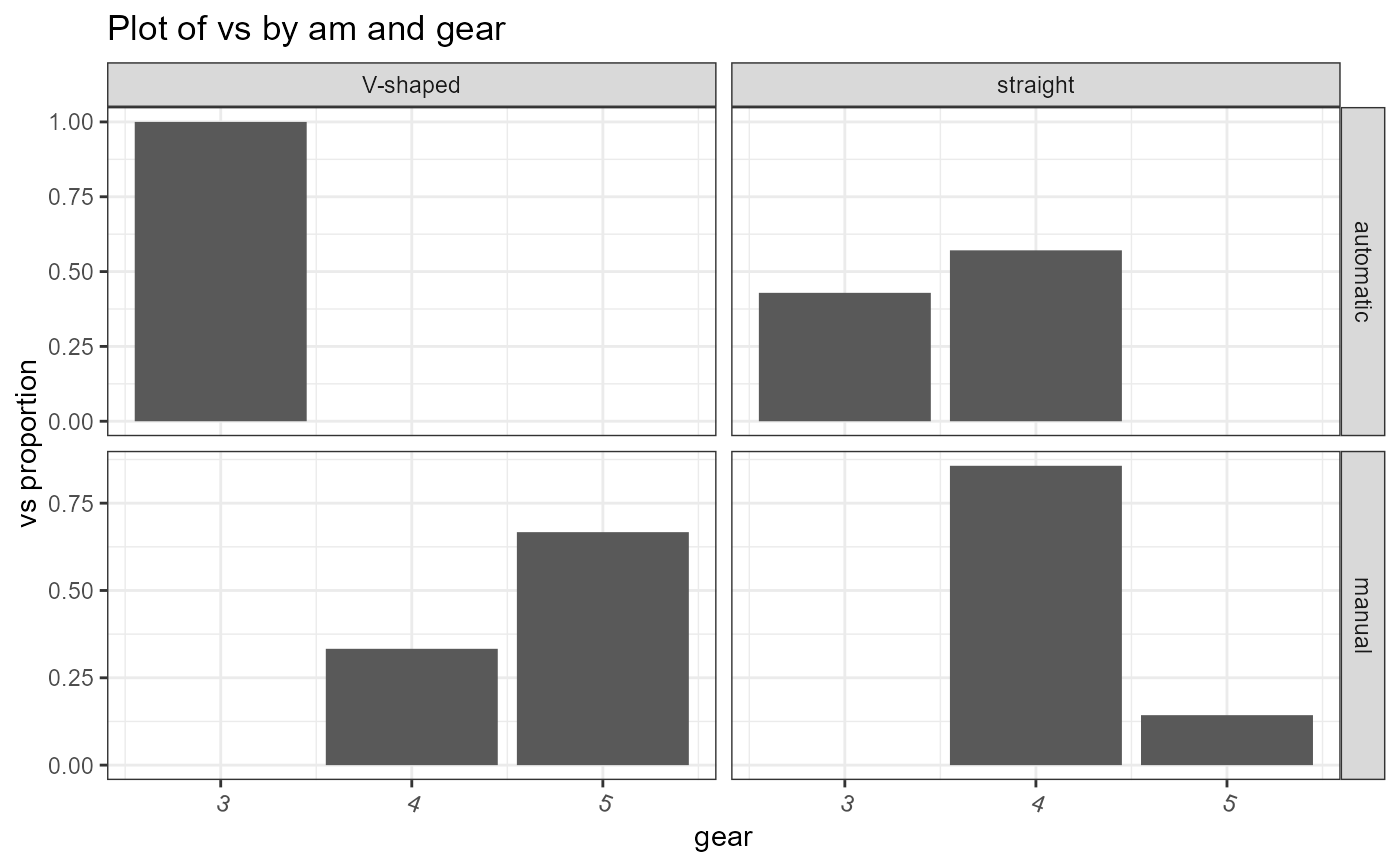
e_plot_table_prop(
dat_plot = dat_mtcars_e
, var_names = c("vs", "am", "gear")
)
#> $table
#> # A tibble: 7 × 5
#> vs am gear n prop
#> <fct> <fct> <dbl> <int> <dbl>
#> 1 V-shaped automatic 3 12 1
#> 2 V-shaped manual 5 4 0.667
#> 3 V-shaped manual 4 2 0.333
#> 4 straight automatic 4 4 0.571
#> 5 straight automatic 3 3 0.429
#> 6 straight manual 4 6 0.857
#> 7 straight manual 5 1 0.143
#>
#> $plot
#>
e_plot_table_prop(
dat_plot = dat_mtcars_e
, var_names = c("vs", "am", "gear")
)
#> $table
#> # A tibble: 7 × 5
#> vs am gear n prop
#> <fct> <fct> <dbl> <int> <dbl>
#> 1 V-shaped automatic 3 12 1
#> 2 V-shaped manual 5 4 0.667
#> 3 V-shaped manual 4 2 0.333
#> 4 straight automatic 4 4 0.571
#> 5 straight automatic 3 3 0.429
#> 6 straight manual 4 6 0.857
#> 7 straight manual 5 1 0.143
#>
#> $plot
 #>
#>