Plot scatterplot of a numeric y-variable against a numeric or categorical x-variable, by up to one color factor or numeric variable and two facets factor variables
Source:R/e_plot_scatterplot.R
e_plot_scatterplot.RdPlot scatterplot of a numeric y-variable against a numeric or categorical x-variable, by up to one color factor or numeric variable and two facets factor variables
Arguments
- dat_plot
data to plot
- var_x
a numeric or categorical variable name
- var_y
a numeric variable name
- var_color
factor or numeric color variable
- var_facet
factor varibles (1 or 2) to facet by, (row facets, then column facets),
- sw_print
T/F whether to print table and display plot
- smooth_all
Smooth method for all the points together.
- smooth_by_var_color
Smooth method by the color variable.
Value
a ggplot objectExamples
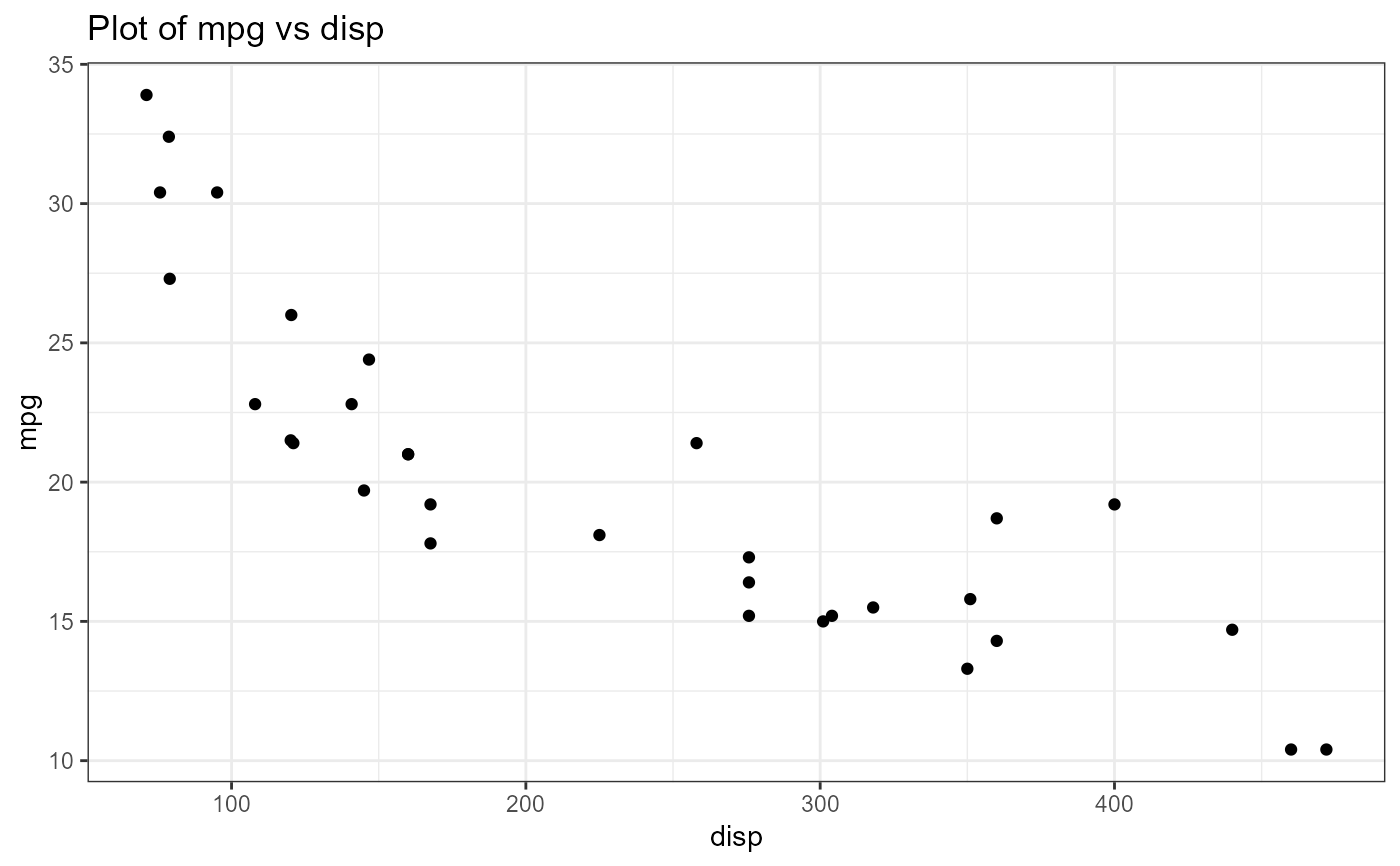
e_plot_scatterplot(
dat_plot = dat_mtcars_e
, var_x = "disp" # numeric x
, var_y = "mpg"
)
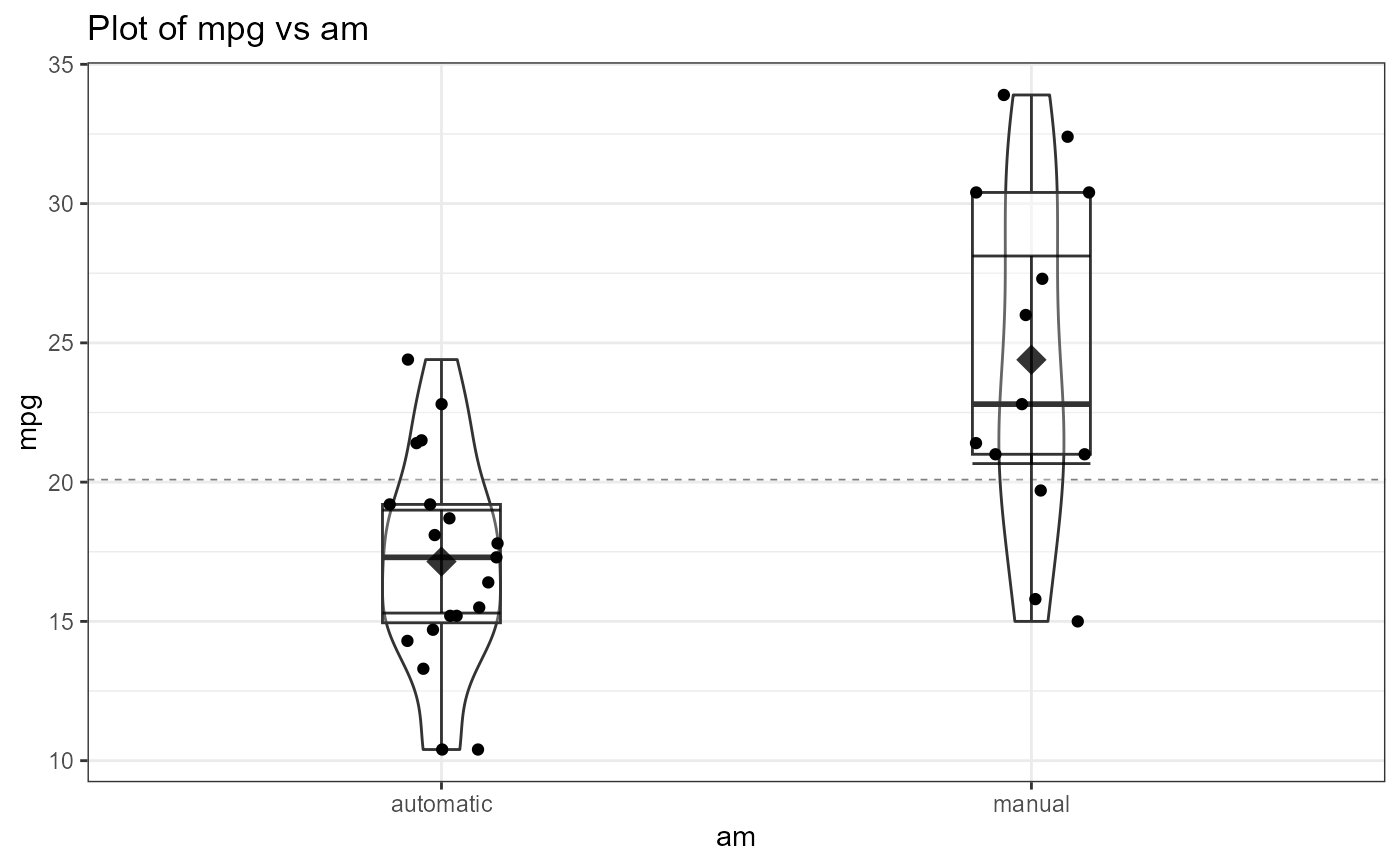
 e_plot_scatterplot(
dat_plot = dat_mtcars_e
, var_x = "am" # factor x
, var_y = "mpg"
)
e_plot_scatterplot(
dat_plot = dat_mtcars_e
, var_x = "am" # factor x
, var_y = "mpg"
)
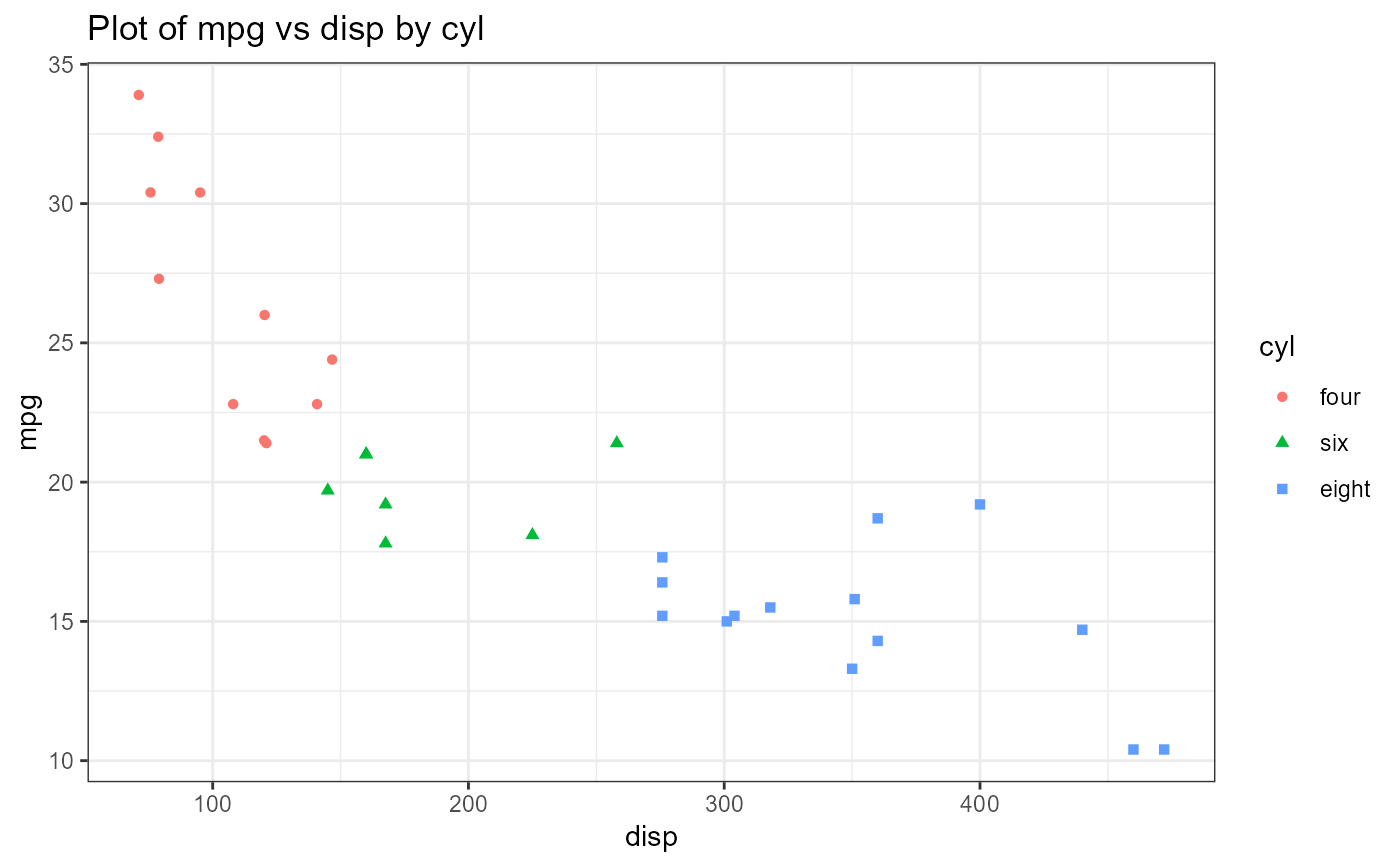
 e_plot_scatterplot(
dat_plot = dat_mtcars_e
, var_x = "disp"
, var_y = "mpg"
, var_color = "cyl" # factor color
)
e_plot_scatterplot(
dat_plot = dat_mtcars_e
, var_x = "disp"
, var_y = "mpg"
, var_color = "cyl" # factor color
)
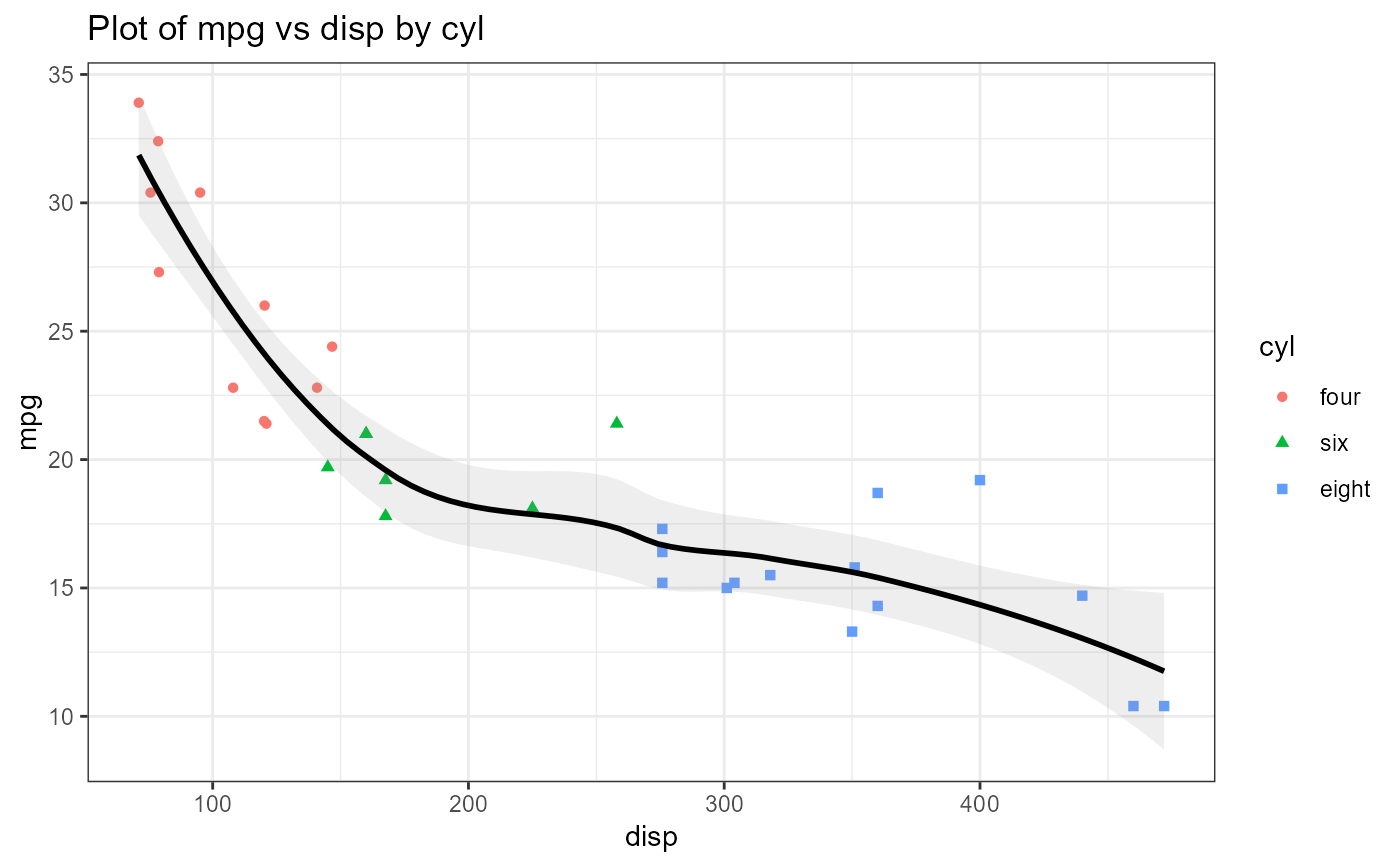
 e_plot_scatterplot(
dat_plot = dat_mtcars_e
, var_x = "disp"
, var_y = "mpg"
, var_color = "cyl" # factor color
, smooth_all = c("none", "loess", "lm", "glm", "gam")[2] # with all smooth
)
#> `geom_smooth()` using formula = 'y ~ x'
#> Warning: The following aesthetics were dropped during statistical transformation: shape
#> ℹ This can happen when ggplot fails to infer the correct grouping structure in
#> the data.
#> ℹ Did you forget to specify a `group` aesthetic or to convert a numerical
#> variable into a factor?
e_plot_scatterplot(
dat_plot = dat_mtcars_e
, var_x = "disp"
, var_y = "mpg"
, var_color = "cyl" # factor color
, smooth_all = c("none", "loess", "lm", "glm", "gam")[2] # with all smooth
)
#> `geom_smooth()` using formula = 'y ~ x'
#> Warning: The following aesthetics were dropped during statistical transformation: shape
#> ℹ This can happen when ggplot fails to infer the correct grouping structure in
#> the data.
#> ℹ Did you forget to specify a `group` aesthetic or to convert a numerical
#> variable into a factor?
 e_plot_scatterplot(
dat_plot = dat_mtcars_e
, var_x = "disp"
, var_y = "mpg"
, var_color = "cyl" # factor color
, smooth_by_var_color = c("none", "loess", "lm", "glm", "gam")[3] # with group smooth
)
#> `geom_smooth()` using formula = 'y ~ x'
e_plot_scatterplot(
dat_plot = dat_mtcars_e
, var_x = "disp"
, var_y = "mpg"
, var_color = "cyl" # factor color
, smooth_by_var_color = c("none", "loess", "lm", "glm", "gam")[3] # with group smooth
)
#> `geom_smooth()` using formula = 'y ~ x'
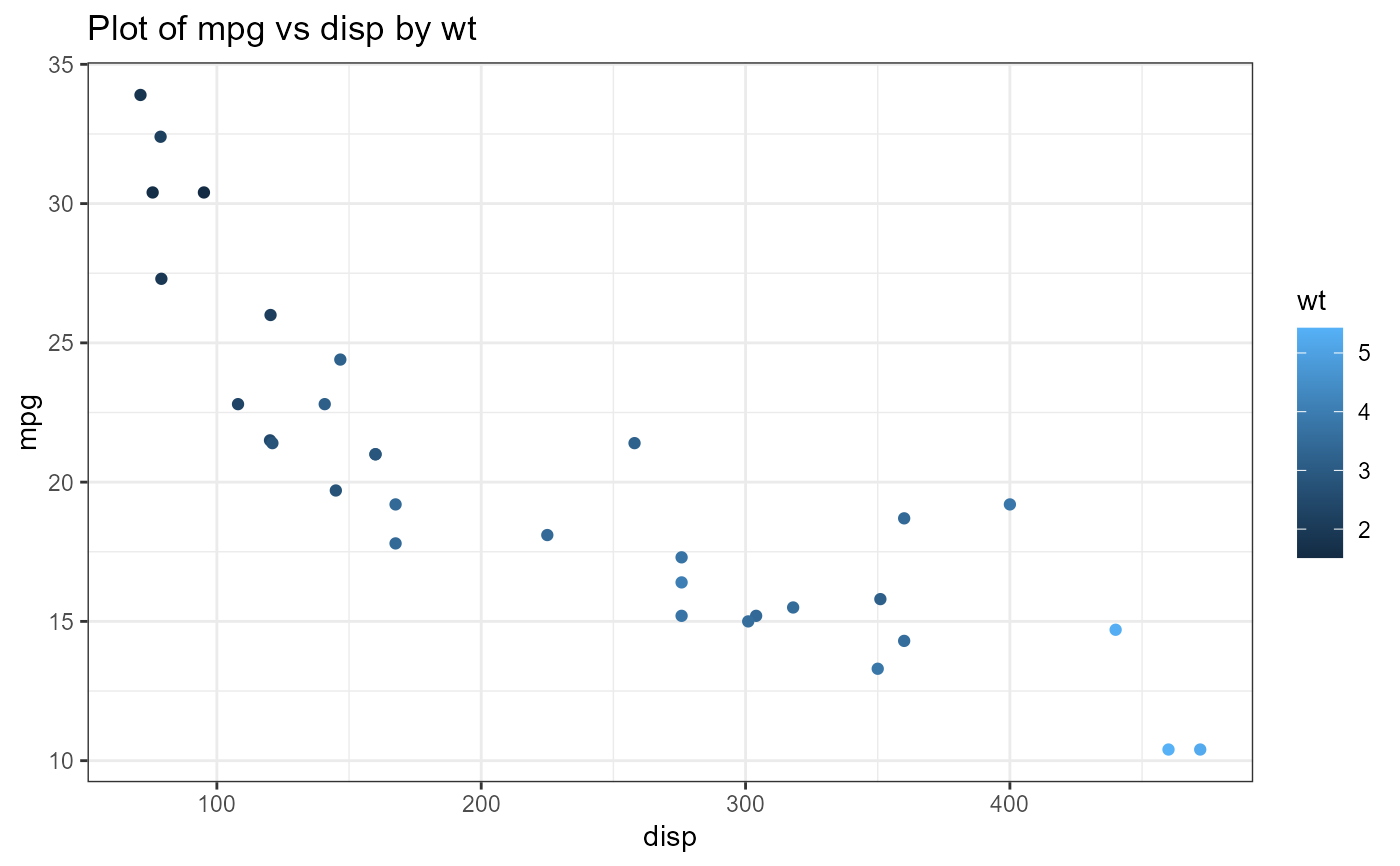
 e_plot_scatterplot(
dat_plot = dat_mtcars_e
, var_x = "disp"
, var_y = "mpg"
, var_color = "wt" # numeric color
)
e_plot_scatterplot(
dat_plot = dat_mtcars_e
, var_x = "disp"
, var_y = "mpg"
, var_color = "wt" # numeric color
)
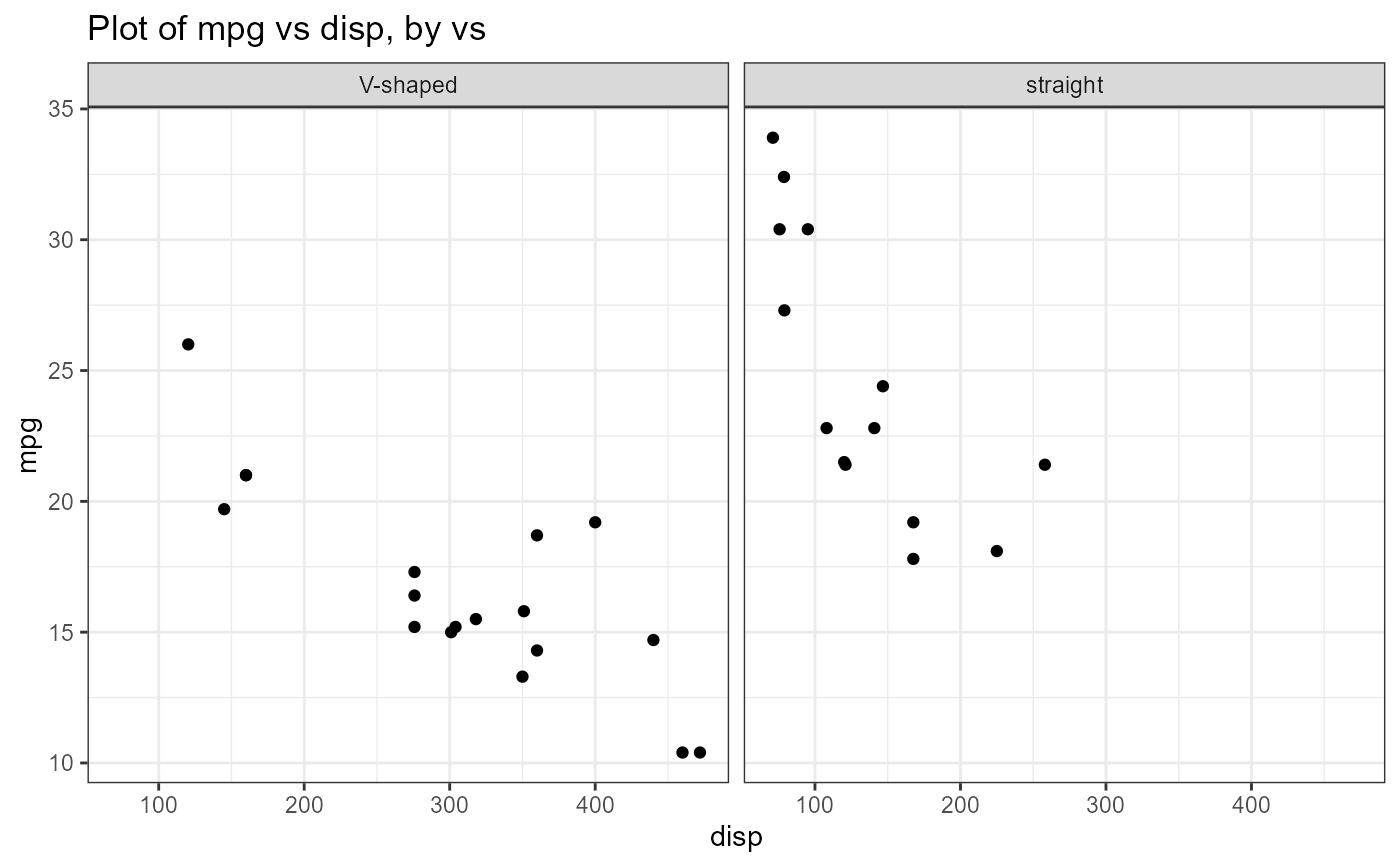
 e_plot_scatterplot(
dat_plot = dat_mtcars_e
, var_x = "disp"
, var_y = "mpg"
, var_facet = c("vs") # one facet
)
e_plot_scatterplot(
dat_plot = dat_mtcars_e
, var_x = "disp"
, var_y = "mpg"
, var_facet = c("vs") # one facet
)
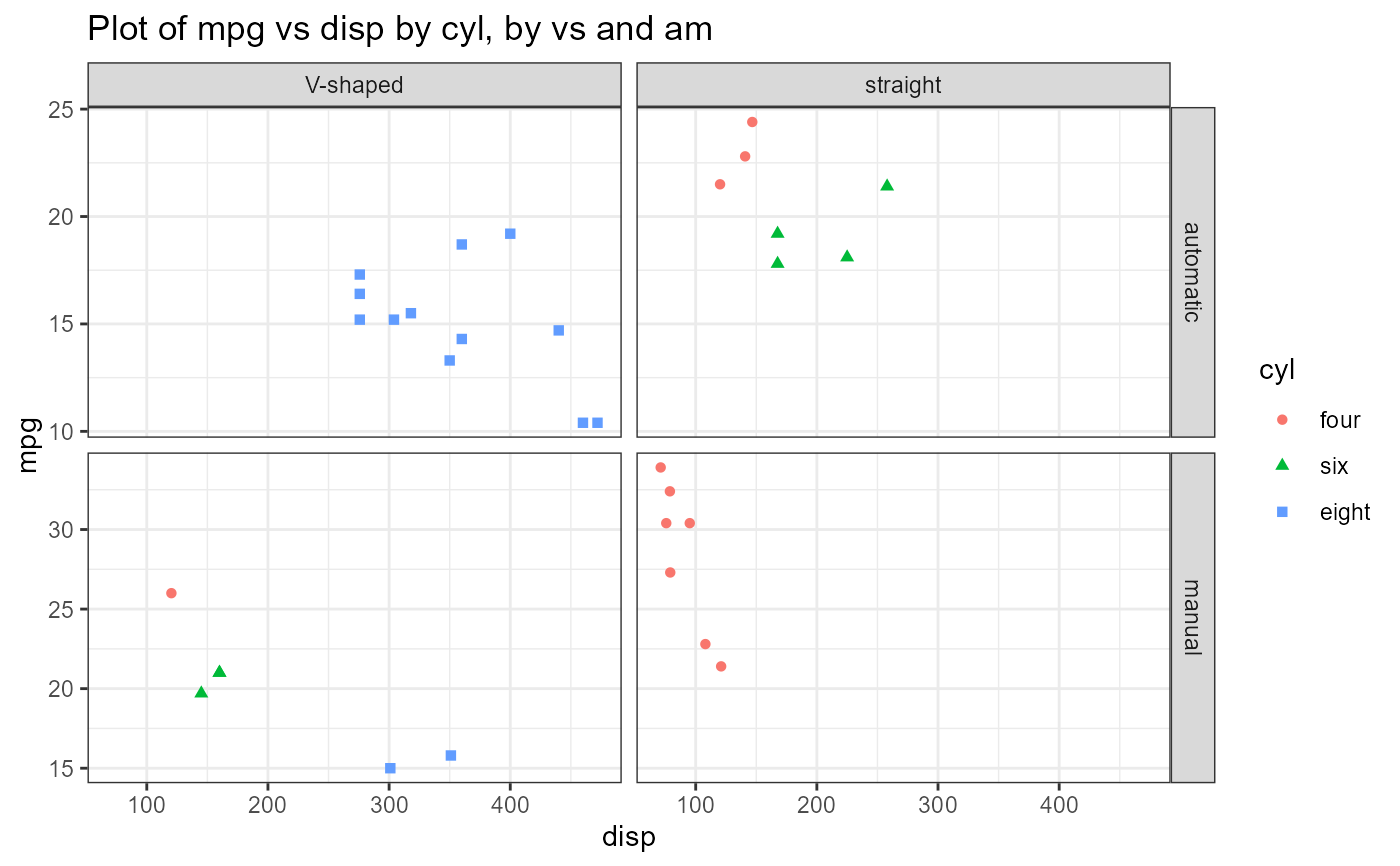
 e_plot_scatterplot(
dat_plot = dat_mtcars_e
, var_x = "disp"
, var_y = "mpg"
, var_color = "cyl"
, var_facet = c("vs", "am") # two facets
)
e_plot_scatterplot(
dat_plot = dat_mtcars_e
, var_x = "disp"
, var_y = "mpg"
, var_color = "cyl"
, var_facet = c("vs", "am") # two facets
)
 e_plot_scatterplot(
dat_plot = dat_mtcars_e
, var_x = "am" # factor x
, var_y = "mpg"
, var_color = "wt" # numeric color
, var_facet = c("vs")
)
#> Warning: The following aesthetics were dropped during statistical transformation: colour
#> ℹ This can happen when ggplot fails to infer the correct grouping structure in
#> the data.
#> ℹ Did you forget to specify a `group` aesthetic or to convert a numerical
#> variable into a factor?
#> Warning: The following aesthetics were dropped during statistical transformation: colour
#> ℹ This can happen when ggplot fails to infer the correct grouping structure in
#> the data.
#> ℹ Did you forget to specify a `group` aesthetic or to convert a numerical
#> variable into a factor?
#> Warning: The following aesthetics were dropped during statistical transformation: colour
#> ℹ This can happen when ggplot fails to infer the correct grouping structure in
#> the data.
#> ℹ Did you forget to specify a `group` aesthetic or to convert a numerical
#> variable into a factor?
#> Warning: The following aesthetics were dropped during statistical transformation: colour
#> ℹ This can happen when ggplot fails to infer the correct grouping structure in
#> the data.
#> ℹ Did you forget to specify a `group` aesthetic or to convert a numerical
#> variable into a factor?
e_plot_scatterplot(
dat_plot = dat_mtcars_e
, var_x = "am" # factor x
, var_y = "mpg"
, var_color = "wt" # numeric color
, var_facet = c("vs")
)
#> Warning: The following aesthetics were dropped during statistical transformation: colour
#> ℹ This can happen when ggplot fails to infer the correct grouping structure in
#> the data.
#> ℹ Did you forget to specify a `group` aesthetic or to convert a numerical
#> variable into a factor?
#> Warning: The following aesthetics were dropped during statistical transformation: colour
#> ℹ This can happen when ggplot fails to infer the correct grouping structure in
#> the data.
#> ℹ Did you forget to specify a `group` aesthetic or to convert a numerical
#> variable into a factor?
#> Warning: The following aesthetics were dropped during statistical transformation: colour
#> ℹ This can happen when ggplot fails to infer the correct grouping structure in
#> the data.
#> ℹ Did you forget to specify a `group` aesthetic or to convert a numerical
#> variable into a factor?
#> Warning: The following aesthetics were dropped during statistical transformation: colour
#> ℹ This can happen when ggplot fails to infer the correct grouping structure in
#> the data.
#> ℹ Did you forget to specify a `group` aesthetic or to convert a numerical
#> variable into a factor?
 e_plot_scatterplot(
dat_plot = dat_mtcars_e
, var_x = "am" # factor x
, var_y = "mpg"
, var_color = "vs" # factor color
)
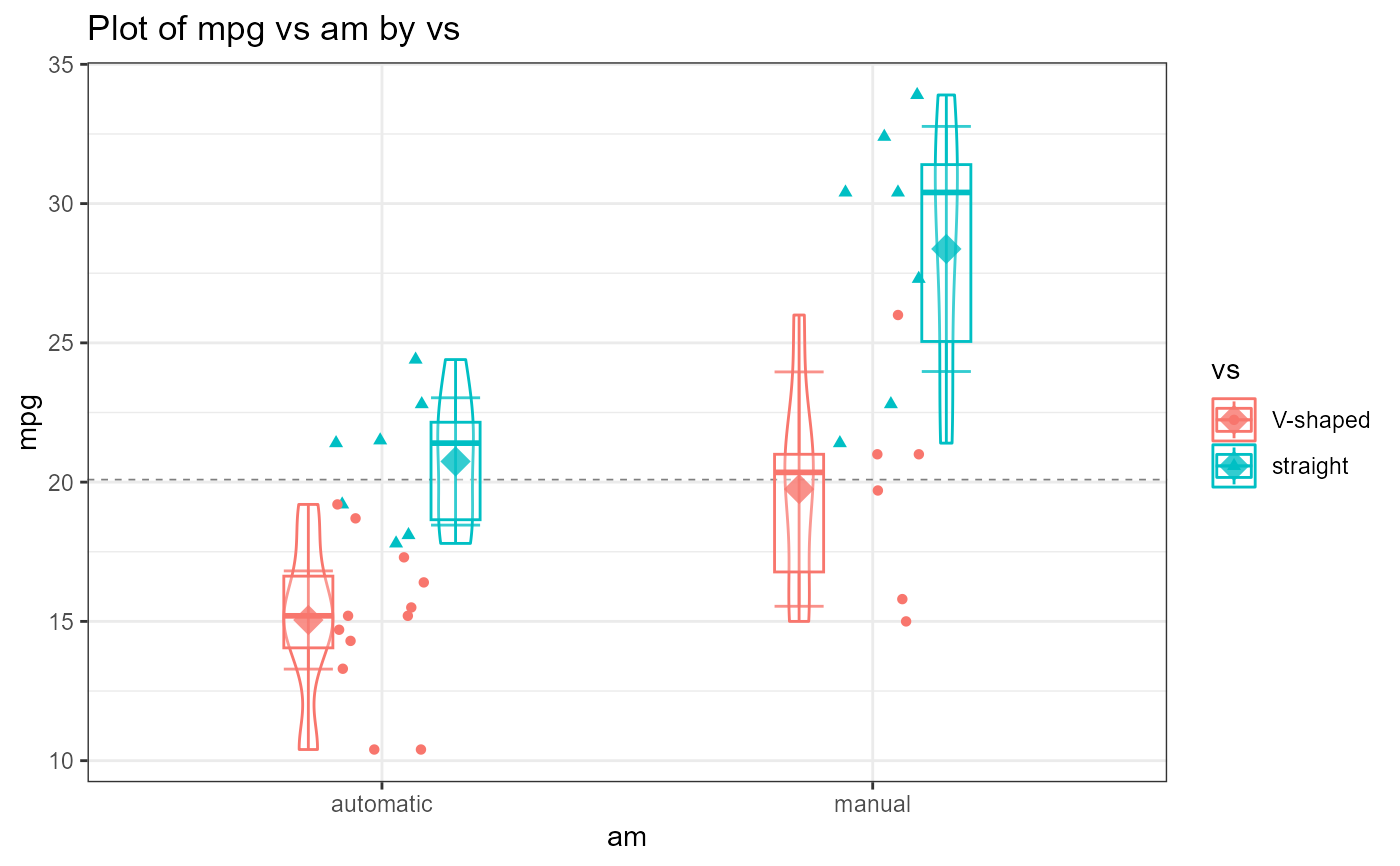
e_plot_scatterplot(
dat_plot = dat_mtcars_e
, var_x = "am" # factor x
, var_y = "mpg"
, var_color = "vs" # factor color
)