Graphical Assessment (QQ-plot) for assessing Multivariate Normality
Source:R/e_plot_mnv_norm_qqplot.R
e_plot_mnv_norm_qqplot.RdGraphical Assessment (QQ-plot) for assessing Multivariate Normality
e_plot_mnv_norm_qqplot(x, name = "")Arguments
- x
data.frame or matrix of numeric columns
- name
label for title
Value
invisible(NULL)
Examples
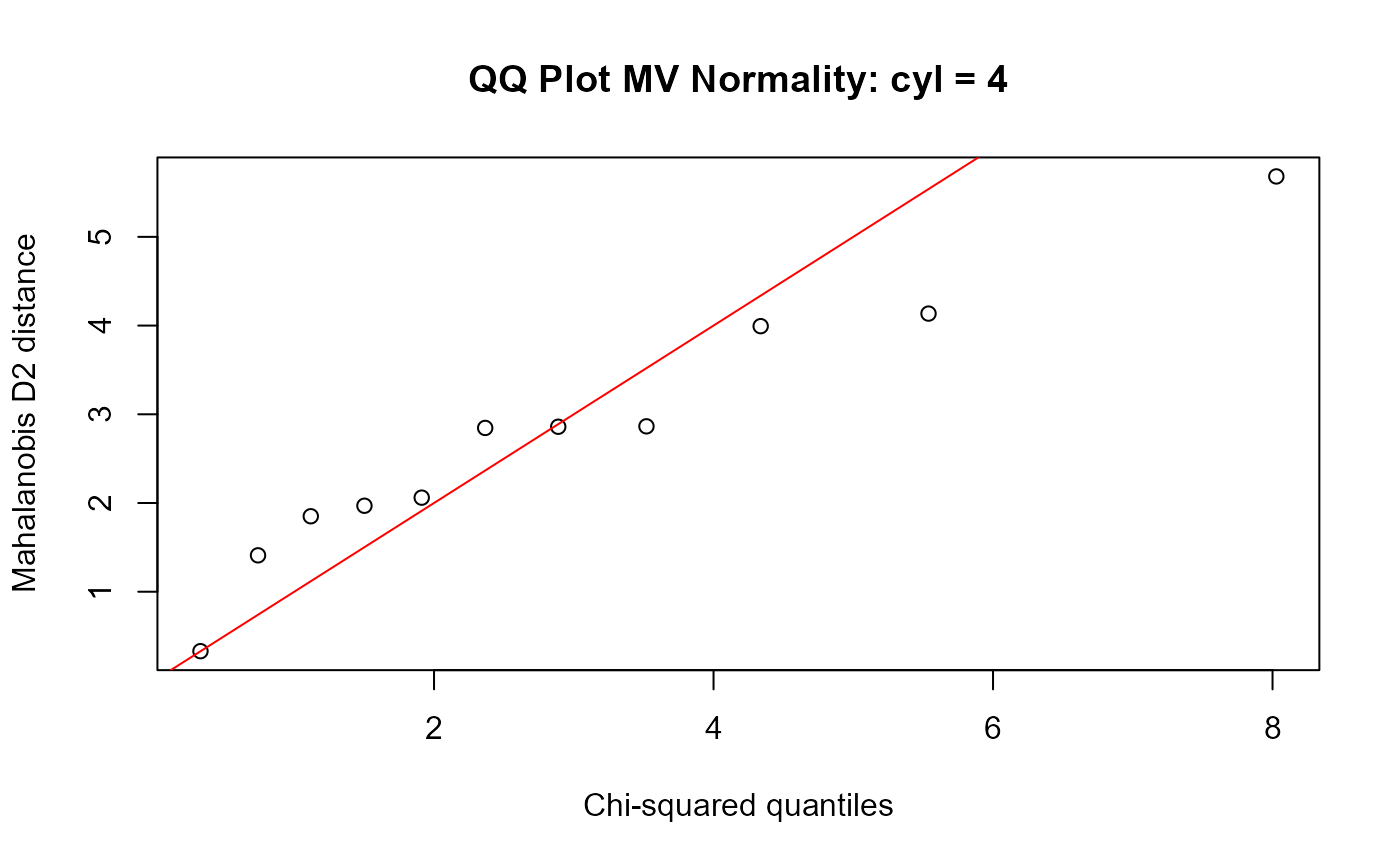
dat_mtcars_e %>%
dplyr::filter(cyl == "four") %>%
dplyr::select(mpg, hp, wt) %>%
e_plot_mnv_norm_qqplot(name = "cyl = 4")
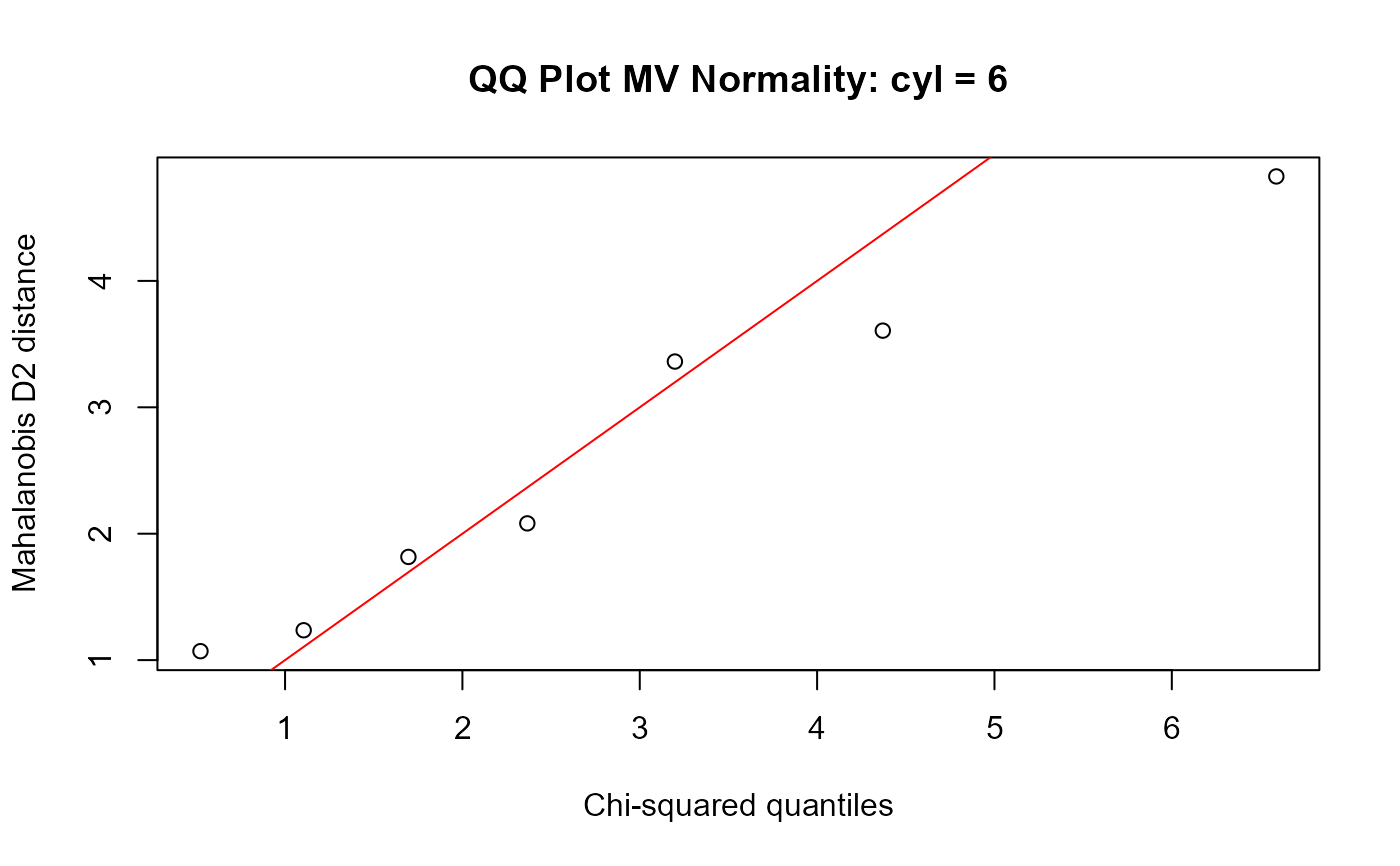
 dat_mtcars_e %>%
dplyr::filter(cyl == "six") %>%
dplyr::select(mpg, hp, wt) %>%
e_plot_mnv_norm_qqplot(name = "cyl = 6")
dat_mtcars_e %>%
dplyr::filter(cyl == "six") %>%
dplyr::select(mpg, hp, wt) %>%
e_plot_mnv_norm_qqplot(name = "cyl = 6")
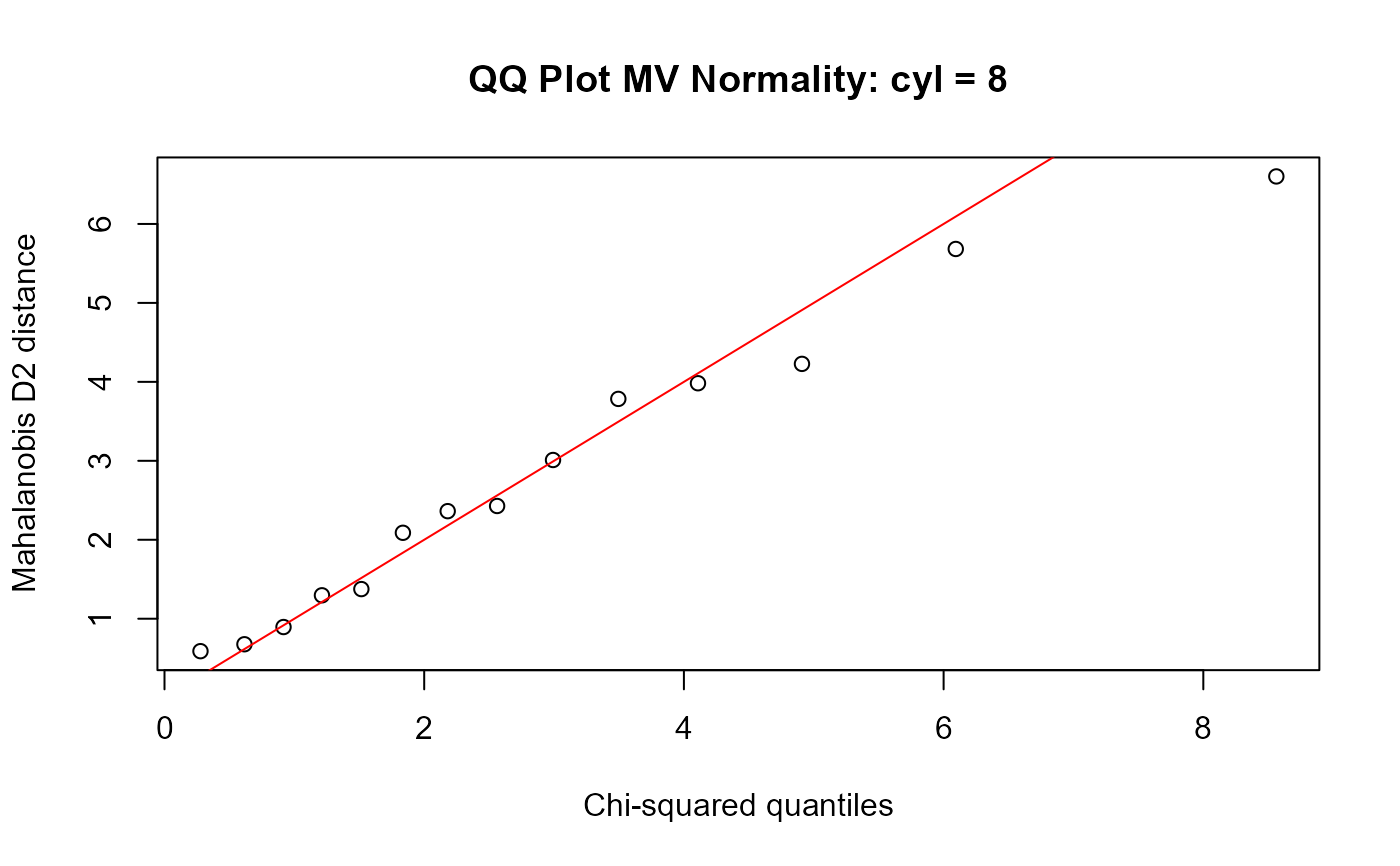
 dat_mtcars_e %>%
dplyr::filter(cyl == "eight") %>%
dplyr::select(mpg, hp, wt) %>%
e_plot_mnv_norm_qqplot(name = "cyl = 8")
dat_mtcars_e %>%
dplyr::filter(cyl == "eight") %>%
dplyr::select(mpg, hp, wt) %>%
e_plot_mnv_norm_qqplot(name = "cyl = 8")