Plots missing data in a data.frame, possibly grouped by one variable and sorted by a second.
Source:R/e_plot_missing.R
e_plot_missing.RdPlots missing data in a data.frame, possibly grouped by one variable and sorted by a second.
e_plot_missing(
  dat_plot,
  var_group = NULL,
  sw_group_sort = FALSE,
  var2_sort = NULL,
  sw_title_data_name = TRUE,
  sw_text_pct_miss = FALSE
)
Arguments
- dat_plot
data.frame or tibble
- var_group
variable name to group by (colors data)
- sw_group_sort
TRUE/FALSE to sort by grouped variable
- var2_sort
second variable name to sort by if data is grouped
- sw_title_data_name
TRUE/FALSE to include data object name in title
- sw_text_pct_miss
TRUE/FALSE to include text values of percent missing on bar plot
Value
ggplot grob plot objectExamples
dat_miss = dat_mtcars_e
prop_missing = 0.10
n_missing = sample.int(n = prod(dim(dat_miss)), size = round( prop_missing * prod(dim(dat_miss))))
ind_missing = expand.grid(1:dim(dat_miss)[1], 1:dim(dat_miss)[2])[n_missing, ]
for (i_row in seq_along(n_missing)) {
dat_miss[ind_missing[i_row,1], ind_missing[i_row,2] ] <- NA
}
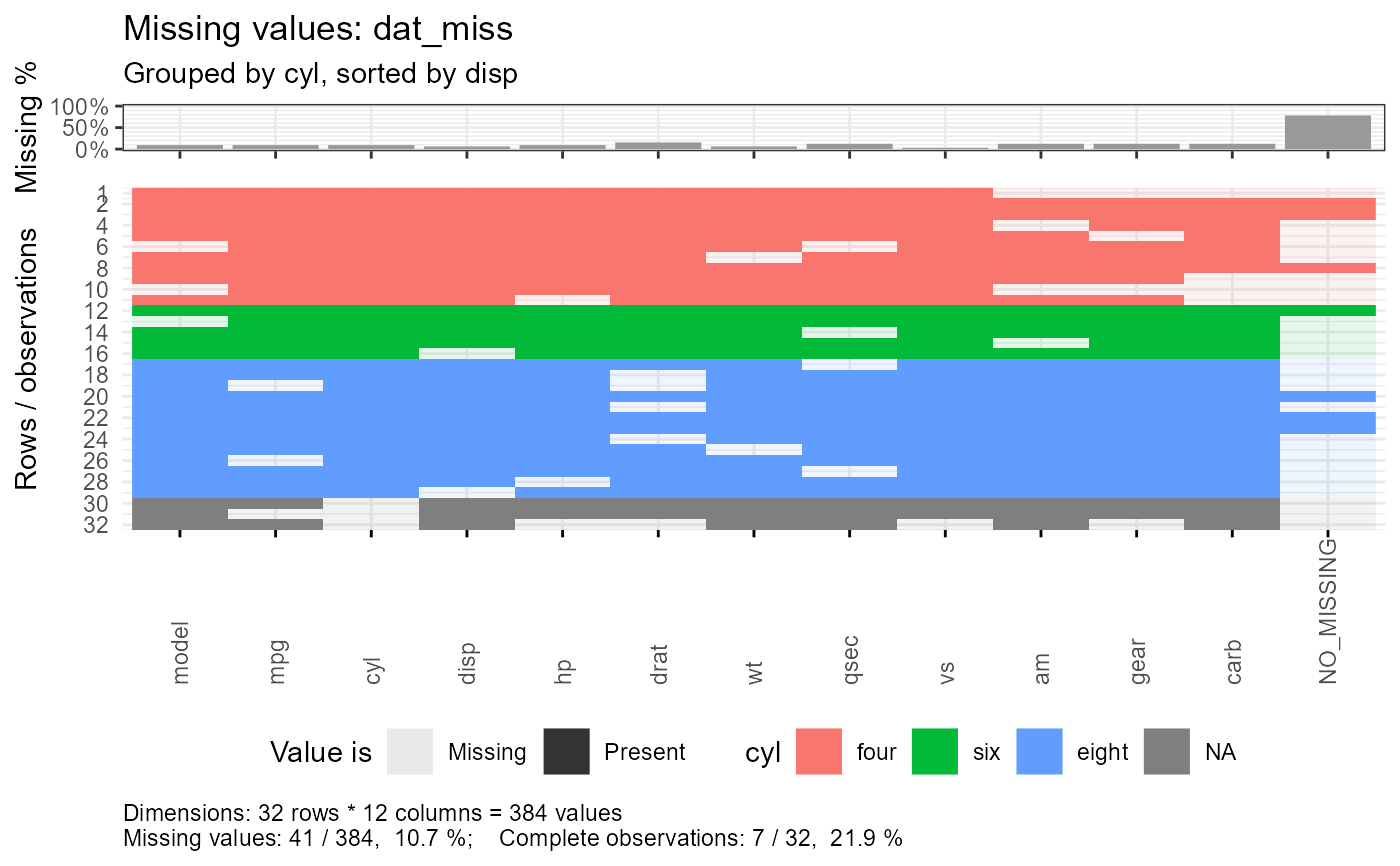
e_plot_missing(
dat_plot = dat_miss
, var_group = "cyl"
, sw_group_sort = TRUE
, var2_sort = "disp"
)
#> Warning: Using alpha for a discrete variable is not advised.