Longitudinal interaction plots
e_plot_longitudinal(
  dat_plot = dat,
  var_x_time = "x",
  var_y_resp = "y",
  var_ID = "ID",
  var_group = NULL,
  label_title = NULL,
  label_subtitle = "Longitudinal plot",
  label_x_time = NULL,
  label_y_resp = NULL,
  label_group = NULL,
  x_scale_breaks = NULL,
  y_scale_breaks = NULL,
  sw_which_plots = c("line", "hist"),
  hist_scale_breaks = NULL,
  sw_group_reverse = FALSE,
  hist_binwidth = NULL,
  hist_align = c("center", "boundary")[1],
  line_type_grand = c("blank", "solid", "dashed", "dotted", "dotdash", "longdash",
    "twodash")[6],
  line_type_group = c("blank", "solid", "dashed", "dotted", "dotdash", "longdash",
    "twodash")[4]
)
Arguments
- dat_plot
data.frame for plotting
- var_x_time
x variable, usually a "time" variable
- var_y_resp
y response variable
- var_ID
ID variable for each repeated measures subject
- var_group
If there are groups, this is the group variable.
- label_title
plot title, defaults to y-variable
- label_subtitle
plot subtitle
- label_x_time
x-axis label
- label_y_resp
y-axis label
- label_group
group label
- x_scale_breaks
breaks for x-axis
- y_scale_breaks
breaks for y-axis
- sw_which_plots
which plots to include, a subset of
c("line", "hist")- hist_scale_breaks
breaks for histogram x-axis
- sw_group_reverse
TRUE/FALSE to reverse the order of groups
- hist_binwidth
histogram binwidth
- hist_align
align "center" or "boundary"? If numeric non-negative responses, usually "boundary" is preferred.
- line_type_grand
Grand mean line type
- line_type_group
Group mean line type
Value
plot in ggplot grob format
Examples
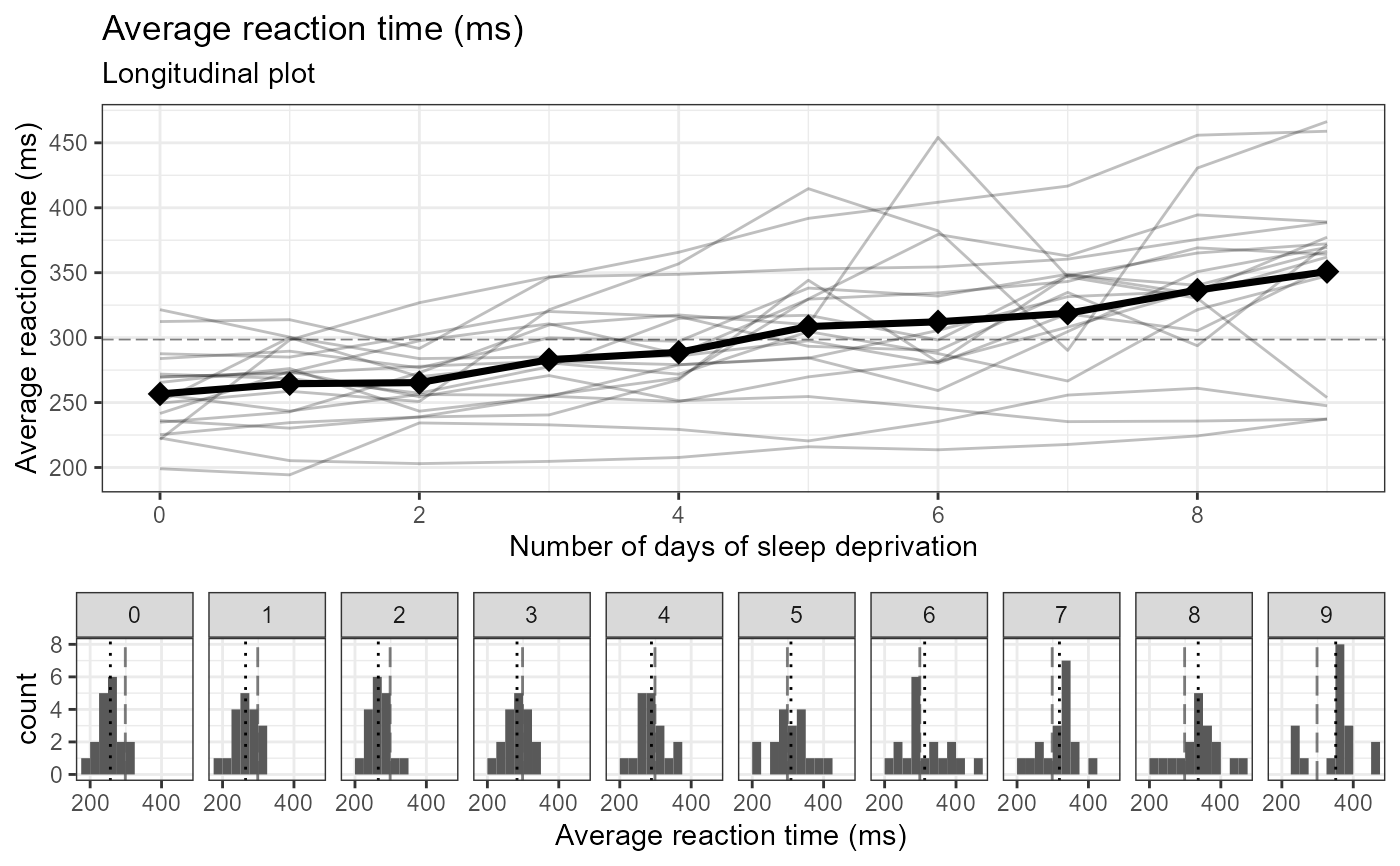
# numeric
e_plot_longitudinal(
dat_plot = lme4::sleepstudy
, var_x_time = "Days"
, var_y_resp = "Reaction"
, var_ID = "Subject"
, var_group = NULL
, label_title = NULL
, label_subtitle = "Longitudinal plot"
, label_x_time = "Number of days of sleep deprivation"
, label_y_resp = "Average reaction time (ms)"
#, label_group = "Program"
, x_scale_breaks = seq(0, 9, by = 2)
, y_scale_breaks = seq(0, 1000, by = 50)
, sw_which_plots = c("line", "hist")
, hist_scale_breaks = NULL
#, sw_group_reverse = TRUE
, hist_binwidth = 25
, hist_align = c("center", "boundary")[2]
, line_type_grand = c("blank","solid","dashed","dotted","dotdash","longdash","twodash")[6]
, line_type_group = c("blank","solid","dashed","dotted","dotdash","longdash","twodash")[4]
)
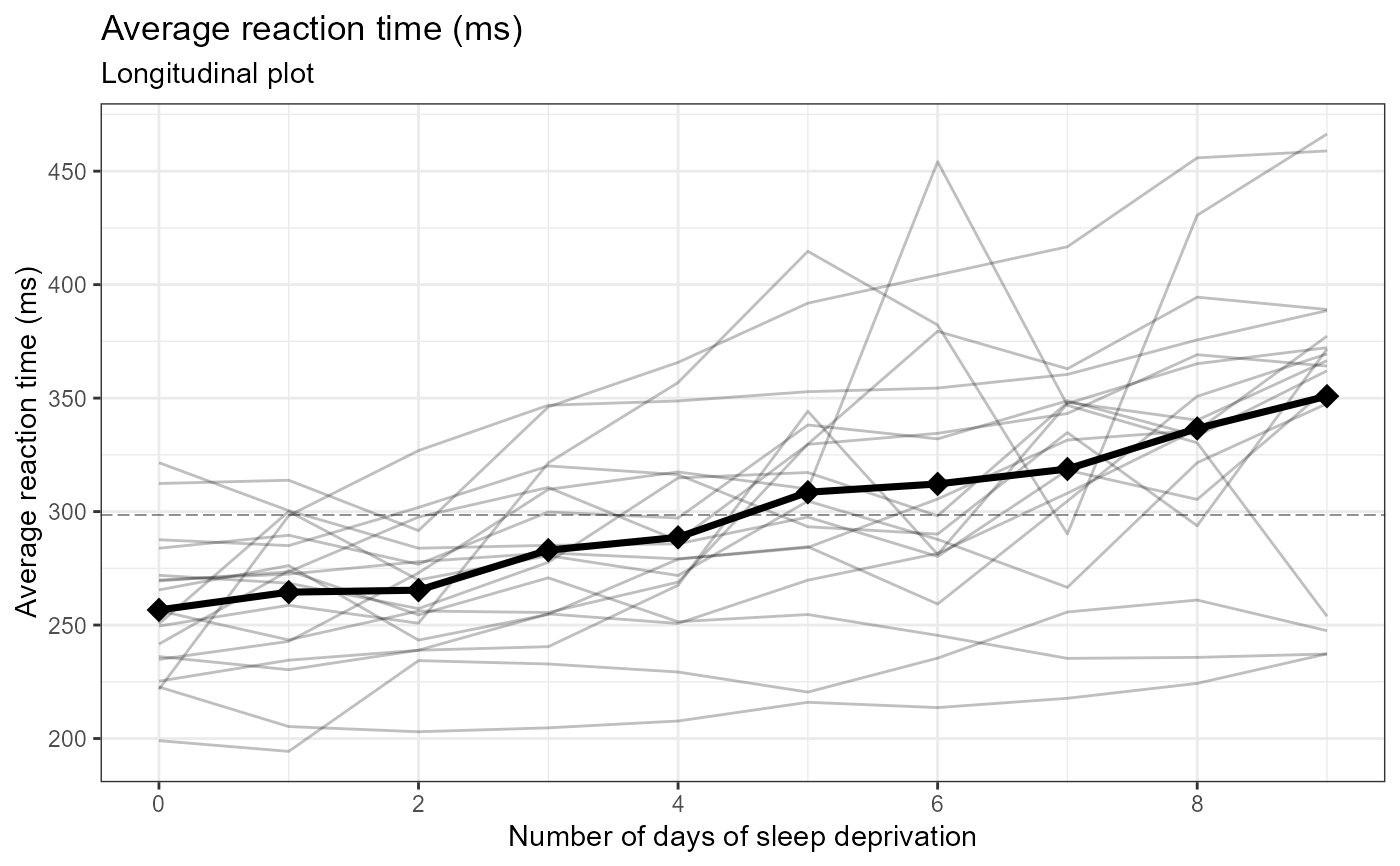
 # numeric, only line plot
e_plot_longitudinal(
dat_plot = lme4::sleepstudy
, var_x_time = "Days"
, var_y_resp = "Reaction"
, var_ID = "Subject"
, var_group = NULL
, label_title = NULL
, label_subtitle = "Longitudinal plot"
, label_x_time = "Number of days of sleep deprivation"
, label_y_resp = "Average reaction time (ms)"
#, label_group = "Program"
, x_scale_breaks = seq(0, 9, by = 2)
, y_scale_breaks = seq(0, 1000, by = 50)
, sw_which_plots = c("line", "hist")[1]
, hist_scale_breaks = NULL
#, sw_group_reverse = TRUE
, hist_binwidth = 25
, hist_align = c("center", "boundary")[2]
, line_type_grand = c("blank","solid","dashed","dotted","dotdash","longdash","twodash")[6]
, line_type_group = c("blank","solid","dashed","dotted","dotdash","longdash","twodash")[4]
)
# numeric, only line plot
e_plot_longitudinal(
dat_plot = lme4::sleepstudy
, var_x_time = "Days"
, var_y_resp = "Reaction"
, var_ID = "Subject"
, var_group = NULL
, label_title = NULL
, label_subtitle = "Longitudinal plot"
, label_x_time = "Number of days of sleep deprivation"
, label_y_resp = "Average reaction time (ms)"
#, label_group = "Program"
, x_scale_breaks = seq(0, 9, by = 2)
, y_scale_breaks = seq(0, 1000, by = 50)
, sw_which_plots = c("line", "hist")[1]
, hist_scale_breaks = NULL
#, sw_group_reverse = TRUE
, hist_binwidth = 25
, hist_align = c("center", "boundary")[2]
, line_type_grand = c("blank","solid","dashed","dotted","dotdash","longdash","twodash")[6]
, line_type_group = c("blank","solid","dashed","dotted","dotdash","longdash","twodash")[4]
)
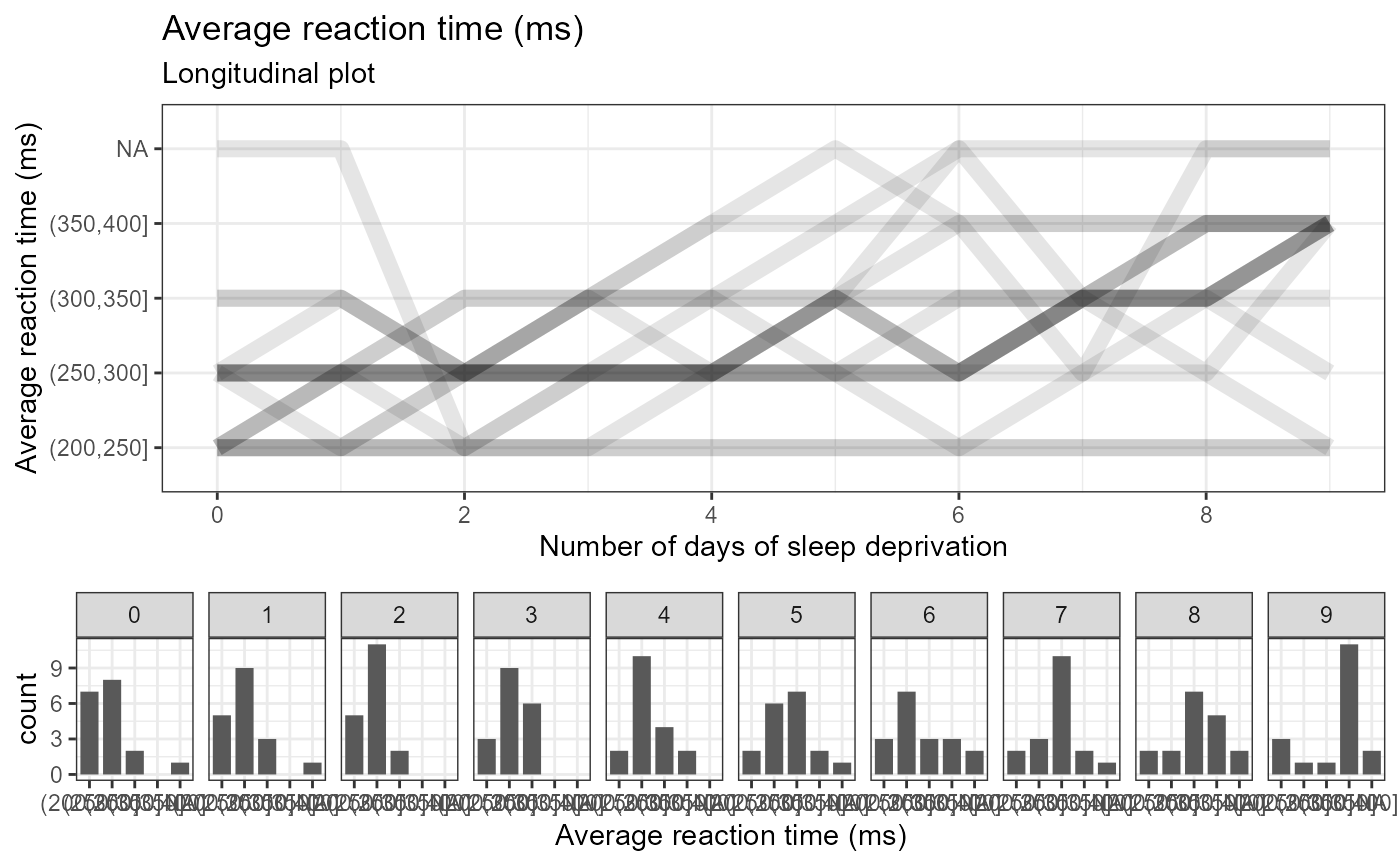
 # categorical
e_plot_longitudinal(
dat_plot = lme4::sleepstudy %>%
dplyr::mutate(Reaction_cat =
cut(Reaction, breaks = seq(200, 400, by = 50))
)
, var_x_time = "Days"
, var_y_resp = "Reaction_cat"
, var_ID = "Subject"
, var_group = NULL
, label_title = NULL
, label_subtitle = "Longitudinal plot"
, label_x_time = "Number of days of sleep deprivation"
, label_y_resp = "Average reaction time (ms)"
#, label_group = "Program"
, x_scale_breaks = seq(0, 9, by = 2)
, y_scale_breaks = NULL
, sw_which_plots = c("line", "hist")
, hist_scale_breaks = NULL
#, sw_group_reverse = TRUE
, hist_binwidth = NULL
, hist_align = c("center", "boundary")[2]
, line_type_grand = c("blank","solid","dashed","dotted","dotdash","longdash","twodash")[6]
, line_type_group = c("blank","solid","dashed","dotted","dotdash","longdash","twodash")[4]
)
# categorical
e_plot_longitudinal(
dat_plot = lme4::sleepstudy %>%
dplyr::mutate(Reaction_cat =
cut(Reaction, breaks = seq(200, 400, by = 50))
)
, var_x_time = "Days"
, var_y_resp = "Reaction_cat"
, var_ID = "Subject"
, var_group = NULL
, label_title = NULL
, label_subtitle = "Longitudinal plot"
, label_x_time = "Number of days of sleep deprivation"
, label_y_resp = "Average reaction time (ms)"
#, label_group = "Program"
, x_scale_breaks = seq(0, 9, by = 2)
, y_scale_breaks = NULL
, sw_which_plots = c("line", "hist")
, hist_scale_breaks = NULL
#, sw_group_reverse = TRUE
, hist_binwidth = NULL
, hist_align = c("center", "boundary")[2]
, line_type_grand = c("blank","solid","dashed","dotted","dotdash","longdash","twodash")[6]
, line_type_group = c("blank","solid","dashed","dotted","dotdash","longdash","twodash")[4]
)