Visual comparison of whether Bootstrap sampling distribution of the difference in means is close to Normal
Source:R/e_plot_bs_two_samp_diff_dist.R
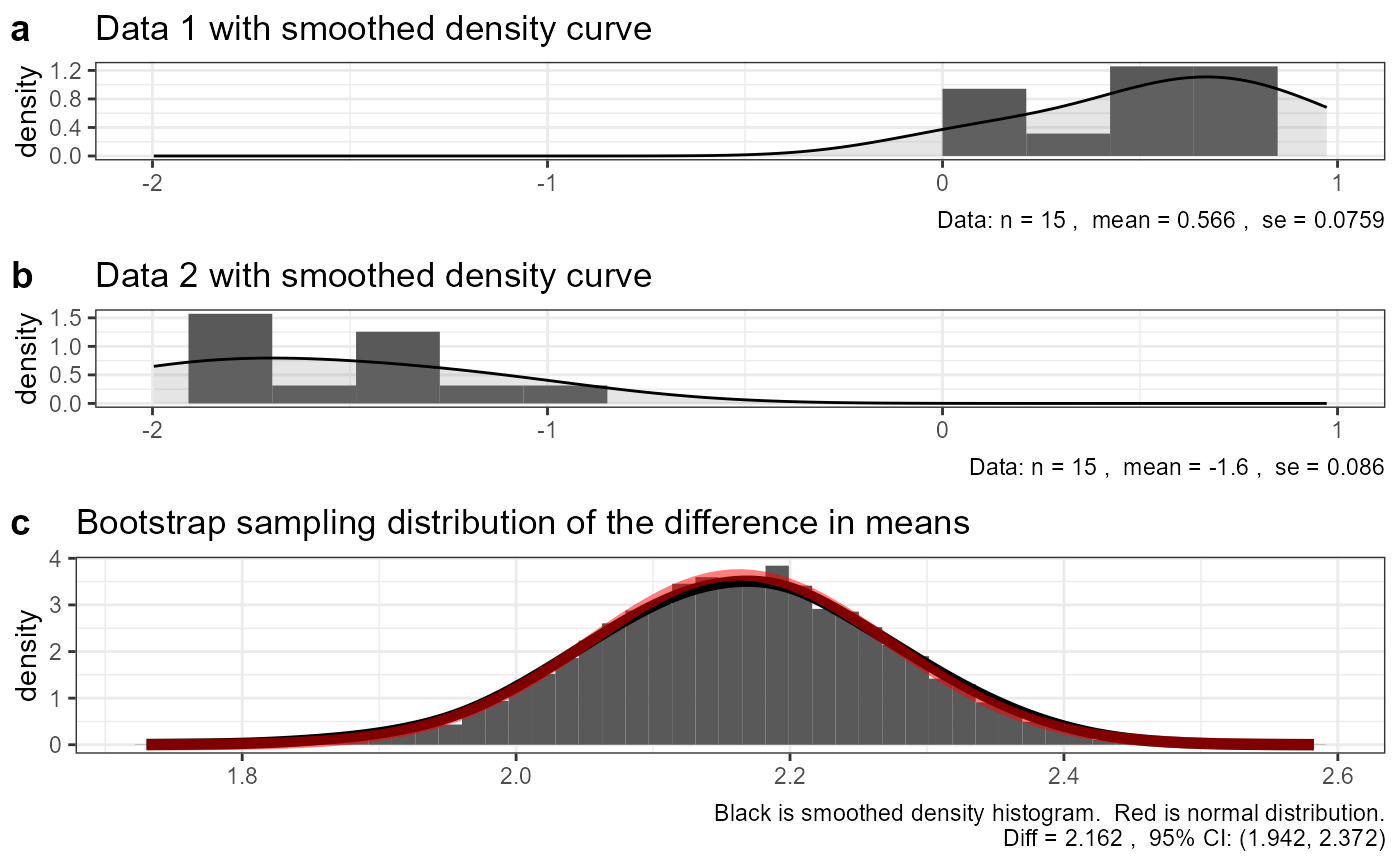
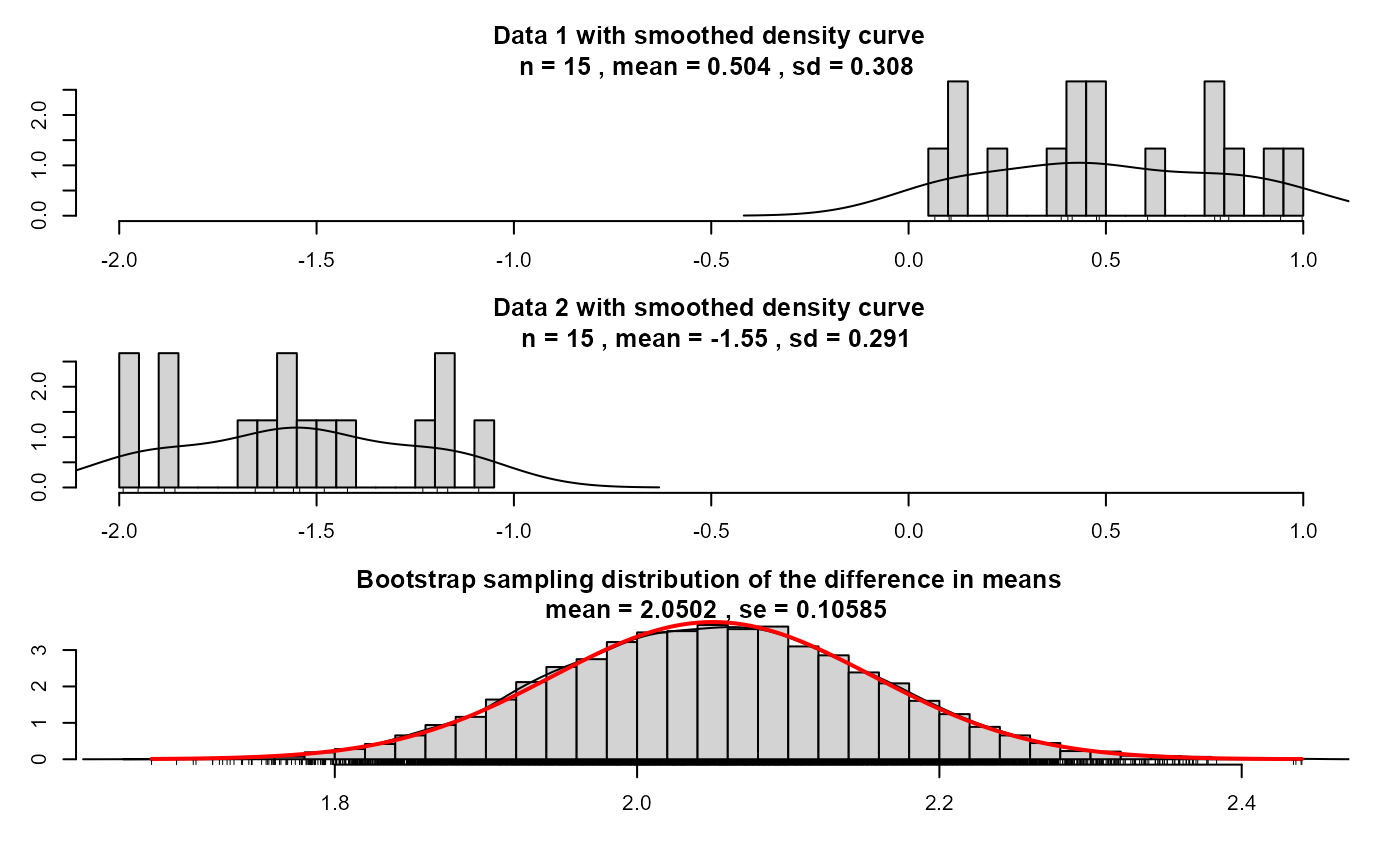
e_plot_bs_two_samp_diff_dist.RdA function to compare the bootstrap sampling distribution of the difference of means from two samples with a normal distribution with mean and SEM estimated from the data
Arguments
- dat1
a list of values from Sample 1
- dat2
a list of values from Sample 2
- N
number of bootstrap iterations
- sw_graphics
use either ggplot or R base graphics
- sw_ggplot_print
if ggplot, print the plot or just return the grob
- conf_level
0.95 for a 95% bootstrap CI
Value
invisible(NULL)
Examples
e_plot_bs_two_samp_diff_dist(dat1 = runif(15), dat2 = runif(15) - 2, sw_graphics = "base")

e_plot_bs_two_samp_diff_dist(dat1 = runif(15), dat2 = runif(15) - 2, sw_graphics = "ggplot")
#> Warning: Removed 2 rows containing missing values (`geom_bar()`).
#> Warning: Removed 2 rows containing missing values (`geom_bar()`).
e_plot_bs_two_samp_diff_dist(dat1 = runif(15), dat2 = runif(15) - 2, sw_graphics = "ggplot")
#> Warning: Removed 2 rows containing missing values (`geom_bar()`).
#> Warning: Removed 2 rows containing missing values (`geom_bar()`).