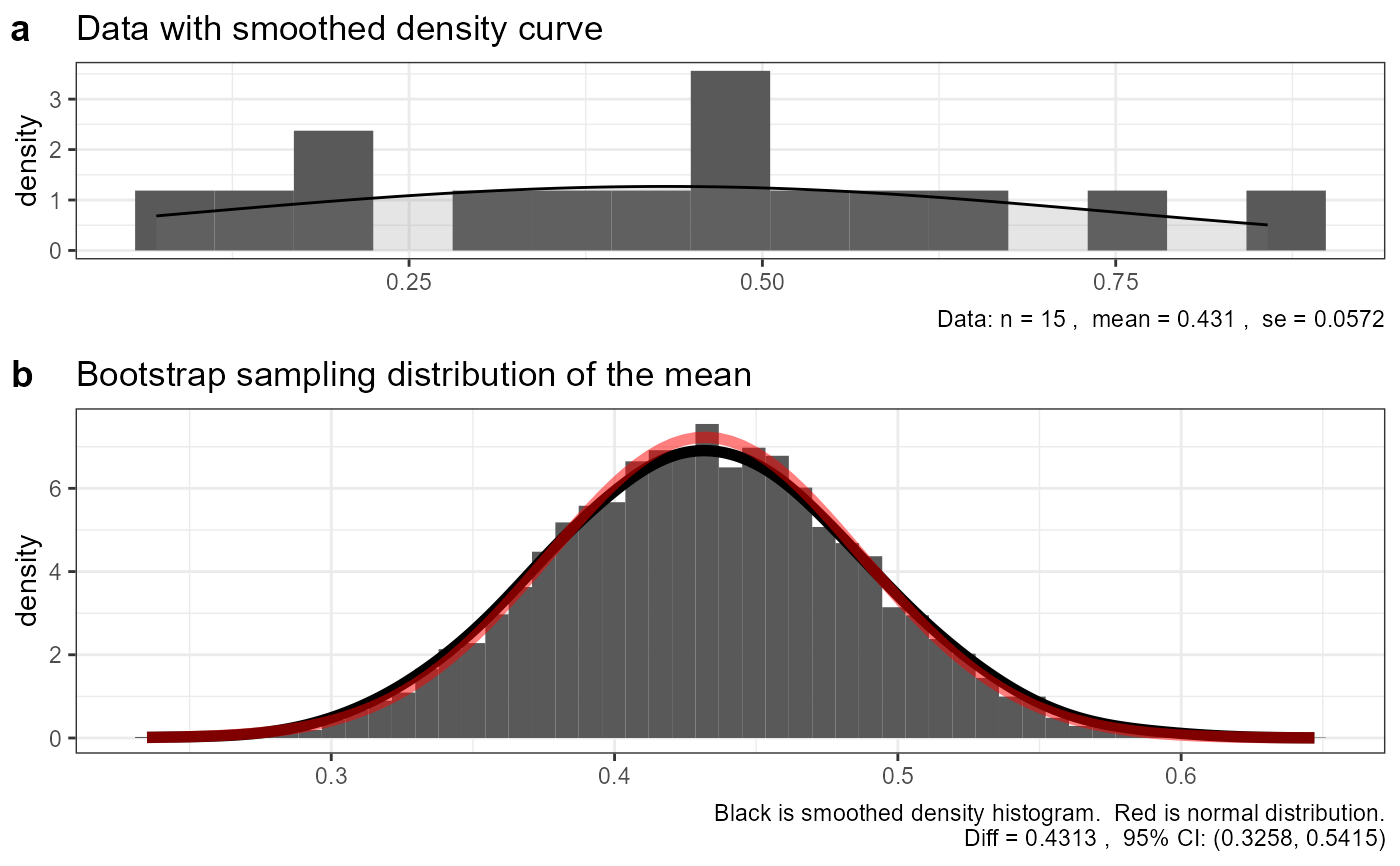
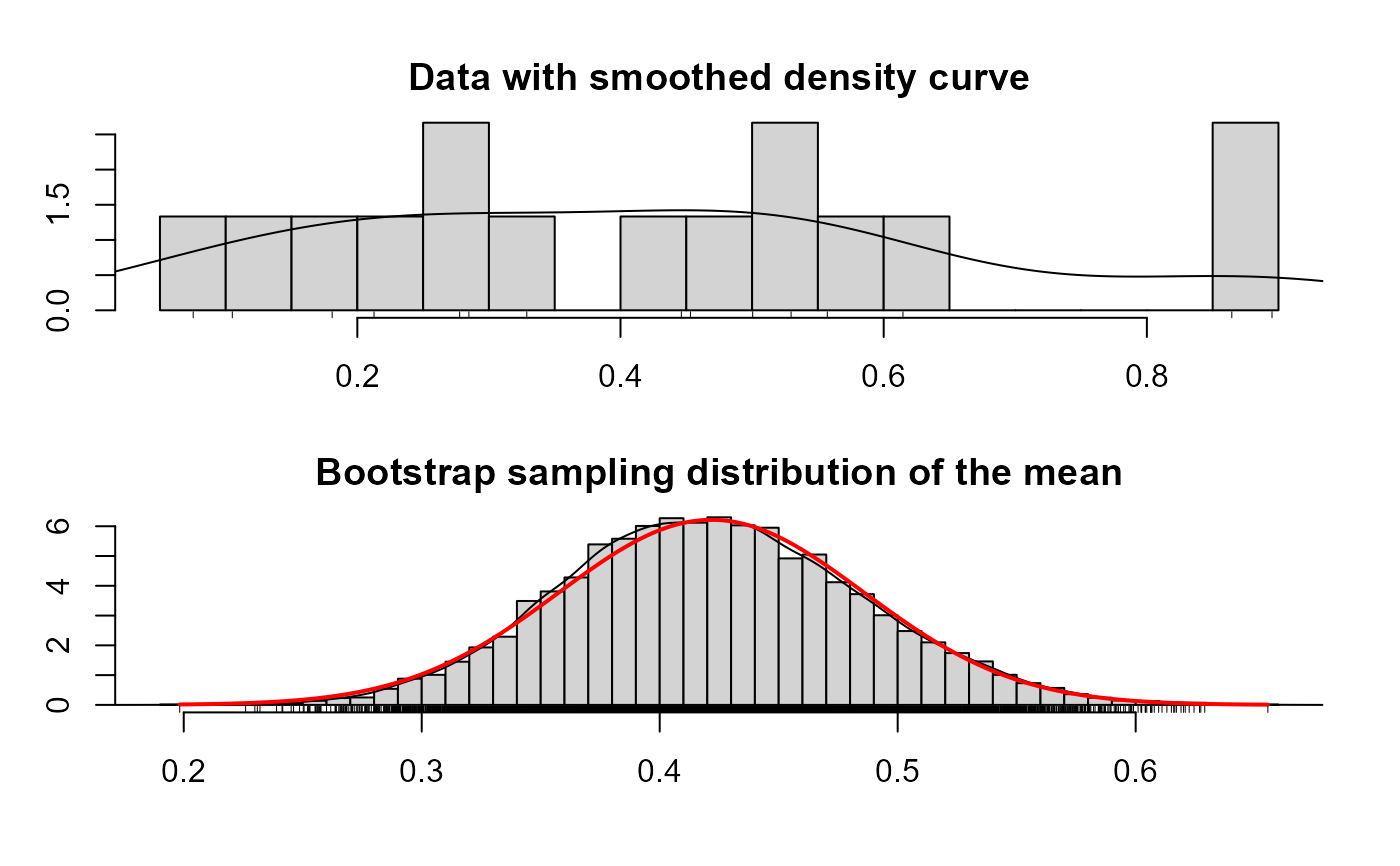
Visual comparison of whether Bootstrap sampling distribution of the mean is close to Normal
Source:R/e_plot_bs_one_samp_dist.R
e_plot_bs_one_samp_dist.RdA function to compare the bootstrap sampling distribution with a normal distribution with mean and SEM estimated from the data
Arguments
- dat
a list of values
- N
number of bootstrap iterations
- sw_graphics
use either ggplot or R base graphics
- sw_ggplot_print
if ggplot, print the plot or just return the grob
- conf_level
0.95 for a 95% bootstrap CI
Value
invisible(NULL) or ggplot grob
Examples
e_plot_bs_one_samp_dist(dat = runif(15), sw_graphics = "base")

e_plot_bs_one_samp_dist(dat = runif(15), sw_graphics = "ggplot")
#> Warning: The dot-dot notation (`..density..`) was deprecated in ggplot2 3.4.0.
#> ℹ Please use `after_stat(density)` instead.
#> ℹ The deprecated feature was likely used in the erikmisc package.
#>   Please report the issue at <https://github.com/erikerhardt/erikmisc/issues>.
e_plot_bs_one_samp_dist(dat = runif(15), sw_graphics = "ggplot")
#> Warning: The dot-dot notation (`..density..`) was deprecated in ggplot2 3.4.0.
#> ℹ Please use `after_stat(density)` instead.
#> ℹ The deprecated feature was likely used in the erikmisc package.
#> Please report the issue at <https://github.com/erikerhardt/erikmisc/issues>.